exp-sd.com
exp-sd.com is for experimental tests I make to do with new technologies or ideas we're planning for future work. These test will not be the finished article but they demonstrate what can happen with various software or coding.
Database to XML to quick-loading SVG Graph
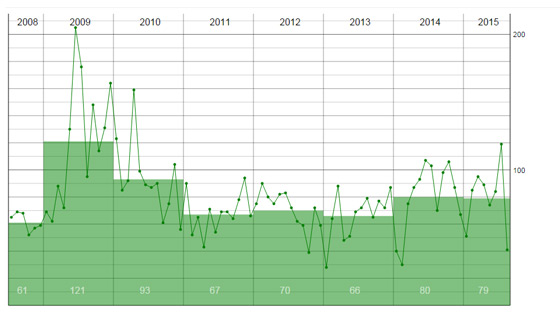
This code is derived from some code I posted on Github in Feb 2014 making a SVG graph from a database. The code is updated and instead of counting all the rows every time the graph is loaded I added an extra stage to take the counting out of the equation. Now, the SVG is super quick-loading because it uses the final "counted" values from a very simple XML file. An alternative way to do this would have been to have the "counted" values in a database.
The dots you see are clickable and they have the mouseover effect of display the date and value for that month.
This PHP code is re-useable and is the engine for several similar graphs.
Added: 07 Aug 2015
Modified:
