exp-sd.com
exp-sd.com is for experimental tests I make to do with new technologies or ideas we're planning for future work. These test will not be the finished article but they demonstrate what can happen with various software or coding.
JSON into a SVG
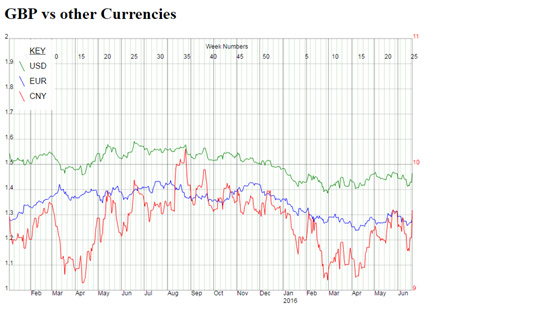
This test grabs currency vs currency data from a JSON API and plots it in graph. Seeing as the data from a particular date isn't going to change in the future there's only one API call per data point.
USD and EUR use the left-hand axis and CNY uses the axis on the right. Because Friday, Saturday and Sunday have the same values I've made Saturday the start of the week.
Added: 22 Jun 2016
Modified: 03 Jan 2021
